The Portal Overview Dashboard contains reports at a glance. Use this dashboard to obtain a quick overview of your team. To view:
Click on the Reports tab and wait for page to load.
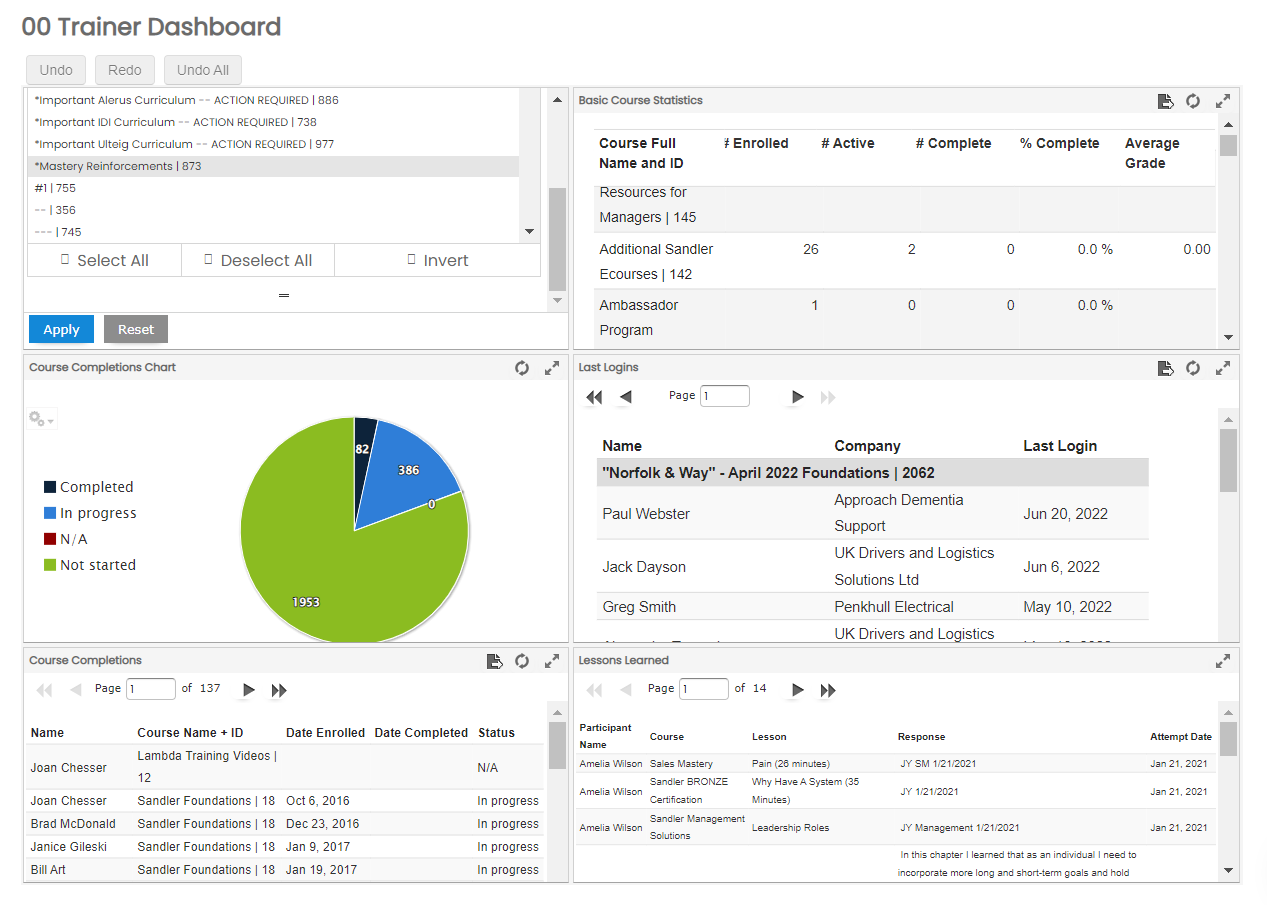
Course Name and ID - Display courses defined by users permissions 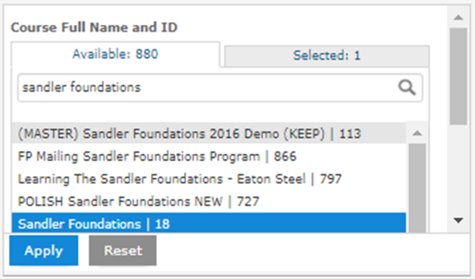
Course Completion Pie Chart - Shows courses Completed, In progress and Not started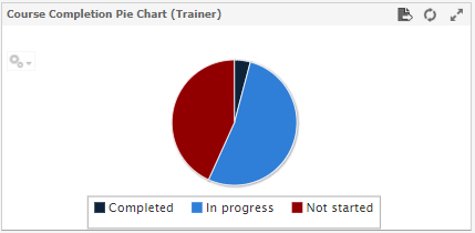
Course Completions Table - Corresponds to D. Total Course completion Report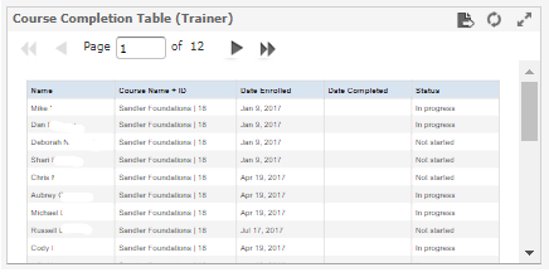
Basic Course Statistics - This will display current data for clients enrolled in the selected course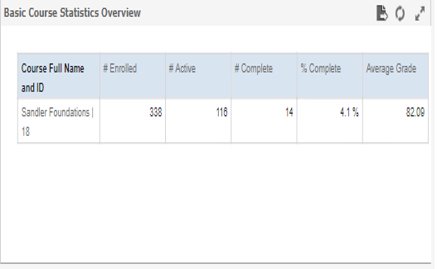
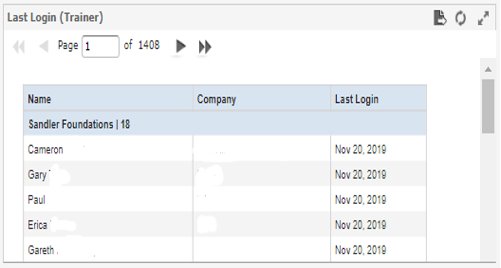
Last Login - Corresponds with A. Last Login Report
C. Lessons Learned Essay Table - Corresponds with C. Lessons Learned Essay Report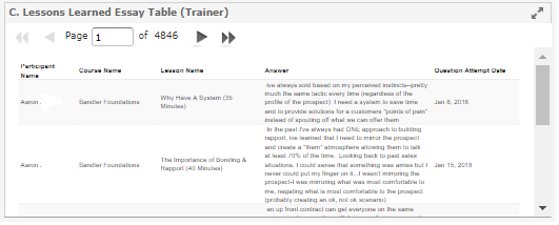
Each section can be exported in the following file formats:
- Excel
- CSV
Note: If you do not see your entire team, please notify your portal administrator who will need to review the user records.
Comments
0 comments
Please sign in to leave a comment.